Cronbach’s Alpha in Excel VBA
by Nick V. Flor • March 8, 2016 • @ProfessorF
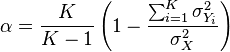
Here’s the bulk of my implementation of Cronbach’s Alpha in Excel VBA. If you’re having problems with the formula on the internet, hopefully this piece of code explains how to translate the math into code. This is the formula:
Note: I use 0-based matrices (0..N-1), vs Excel matrices which go from 1..N. This makes it easier for me to convert the code to JavaScript or CE. Also, there’s a pre-processing function I use (not shown) that converts an Excel Selection range into a 0-based matrix, which is the Y parameter and corresponds to your columns of data that are part of your index X. Finally I use many utility functions like createMatrix, which should be self-explanatory.
Function fCron(Y)
Dim mRows, nCols, i, j
Dim X, V, sumVY, VX
    getNumRowsCols Y, mRows, nCols

    ' Calculate X vector=SUM Y-Rows
    X = createMatrix(mRows, 1)
    For i = 0 To (mRows - 1)
        For j = 0 To (nCols - 1)
            X(i, 0) = X(i, 0) + Y(i, j)
        Next
    Next
    VX = fVar(X, 0) ' Variance of X

    ' Calculate Variances of Ys
    VY = createMatrix(1, nCols)
    sumVY = 0
    For j = 0 To (nCols - 1)
        VY(0, j) = fVar(Y, j) ' for debugging
        sumVY = sumVY + VY(0, j) ' Sum of Y Variances
    Next

    k = nCols
    fCron = (k / (k - 1)) * (1 - (sumVY / VX))
End Function
If you need help implementing any of these functions or understanding the code, I’m happy to answer your questions.
In my opinion, Excel cannot be beat for Exploratory Data Analysis of social media postings. It’s just missing a couple of key functions like factor extractions, factor rotation, reliability indicators, clustering, sentiment analysis, and social networking graphs.
Good luck!