How to Create a Meme, Part 1: ProfessorF’s 4V Theory of Memes

There are no surefire formulas for creating memes, but there is “ProfessorF’s 4V Theory of Memes.”

One of the questions students always ask me is: How do you create a tweet that goes viral? Now if I could answer that question, I would be rich indeed. It’s plainly non-trivial, otherwise everyone would be creating memes and making money off of the ad revenue.

The problem is that creating a meme, like writing a best-selling novel or like shooting a successful box-office movie, is what I call a dialectical problem—a problem whose solution changes whenever someone solves it.

So if someone creates a meme, you can’t just copy it and expect it to go viral. You may get lucky and pass it off as your own to an unsuspecting group, but generally once someone creates a meme, you have to come up with a new one.

Many people have tried to give formulas. YouTube’s content manager gave a three-part formula for making a video go viral:

  1. Create unexpected content;
  2. Get your content to one or more tastemakers who will…
  3. Spread it to communities of participation.

The problem is that (1) just begs the question: What is unexpected content?

This is where my 4V Meme Theory comes in.  Information will spread if it contains at least one of the following elements:

  1. Value. An example is the answers to a difficult test.
  2. Violation (of expectations).
  3. Verification (of a widely held but unproven belief).
  4. Validation (by an authority of a widely held but unproven belief).

So, if your tweet, your video, or whatever social media content you create, contains at least one of these 4 elements it at least has a chance to go viral.  There are no guarantees. Tastemakers and communities of participation are important, but your content first needs one of these four elements.

In my next article, we’ll look at examples of memes containing Value, Violation, Verification, and Validation.


Cognitive Gamification, Part 1: Definition

If only the hard things in life were fun, imagine how successful everyone would be. Gamification provides hope, but it has limitations.

Cleaning your room. Learning calculus. Exercising daily. The mere thought of doing these things gives you that horrible feeling in the pit of your stomach.

Don’t kid yourself. When you’re faced with an activity that’s boring, difficult, or repetitive, the first thought that comes to mind is: “Isn’t there something else I should be doing?” Aka procrastinating. We all do it, and we do it a lot! But failing to procrastinate, the next thought is always: “Why can’t this be more fun?”

That question gets to the very heart of what’s known as “gamification”. Simply put:

Gamification is the process of taking an un-fun activity and making it fun by adding gaming elements.

Gaming elements include score-keeping, competition, cooperation, collectibles, and redeemables, to name but a few.

Some recent examples of gamified activities include:

  • Nike+ FuelBand, a hardware wristband and a smartphone app that gamifies exercise through score-keeping.
  • Pokemon GO, a videogame that gamifies exercise, albeit unintentionally, via collectibles.
  • Duolingo, a multi-platform app that gamifies language learning via interactivity.
  • Starbucks Rewards, gamifies purchases via redeemables.
  • Microsoft Rewards, gamifies the use of Microsoft software, such as Bing Search or the Edge Browser, via redeemables.
  • America’s Army, a videogame developed by the US Army that gamifies combat maneuvers via a combination of videogame elements.
  • My own research on pair programming, gamifies computer programming via cooperation.

This list makes it clear that many different things can be gamified, but can any activity be gamified? The answer is yes, but there is no guarantee that the gamified activity is an improvement over the existing activity.

We need principles to guide the gamification of activities.

Cognitive gamification is the application of principles from cognitive science to transform unfun into fun activities.

In part 2, we’ll explore the evolutionary basis for why people like playing games.

The 2D Rotation Matrix

Nick V. Flor • March 20, 2017 • @ProfessorF

Mathematicians on the internet are not only incomprehensible but annoying with some of their conventions: confusing subscripts, over reliance on symbols, etc.  They either don’t know how to communicate or they’re purposely trying to look smart.

Any intelligent fool can make things bigger, more complex, and more violent. It takes a touch of genius — and a lot of courage — to move in the opposite direction.

 – E. F. Schumacher, Economist

One thing that particularly annoys me is how they treat rotation matrices.  This is what almost every mathematician on the internet gives as a rotation matrix:

Cos(angle) -Sin(angle)
Sin(angle) Cos(angle)

The reason I don’t like this rotation matrix is because it describes a clockwise rotation, which is BACKWARDS from what EVERY STUDENT is taught in school. For example, remember how you drew a 45 degree angle in junior high? Starting at the x-axis, you swept your pencil halfway between the x and y-axis, in a counter-clockwise motion, then drew a line. Same with a 90 degree angle, you swept your pencil counter-clockwise starting from the x-axis until it was vertical.

This is the “correct” rotation matrix, where “correct” means it corresponds to how we were taught rotation in school:

Cos(angle) Sin(angle)
-Sin(angle) Cos(angle)

Why mathematicians provide a “backwards” rotation matrix is beyond me. But I’m told one should never attribute to malice that which can be explained by ignorance. So I’ll close this very short essay by pleading with Math departments to force their mathematicians to take a communications or a technical writing course as a graduation requirement.

The Last Minute

Nick V. Flor • March 20, 2017 • @ProfessorF

It’s rare to find people that complete their work way ahead of time. Let’s be honest. If you’re like most people, you do things at The Last Minute.  This is true of almost all students, and (surprisingly) teachers as well.

Now, because so many people do things at The Last Minute, I’ve invented this pithy saying that I tell all my students who cry about all the work they have to do in such a short amount of time:

Stop complaining & remember this: “If not for the last minute, nothing would get done.”

Important note: I didn’t say you’d get quality work done in the last minute, just that something would get done. And something is better than nothing.

The Last Minute allows you turn in something.

Of course, the real truth is that students ought to plan their work and work their plan ahead of time; then the last minute wouldn’t exist. But since students (& teachers) are actually bad at planning work, let’s look at some things you can do to make sure the work you do turn in at the last minute is somewhat of quality, rather than something questionable:

Think about the problem in the meantime.

If you’re not going to work on the problem until The Last Minute, at least think about it so that when you do start working you’ll have some direction and have a head start.

Breakdown your work into Tasks With Times.

For example, if you have a 1000 page paper that needs to have a thesis statement, argument, and conclusion, along with diagrams, and you have 4 hours to do it—break this up into 4 tasks (thesis, argument, conclusion, diagram), each one hour a piece.

Abandon a task once you hit its time deadline and move onto the next task.

Once you hit your task’s deadline, you have to go with whatever you have and move onto the next task. Give each task it’s due and no more. Leonardo da Vinci is reported to have said: “Art is never finished, it is merely abandoned.” So abandon once you hit the deadline.

Take heart knowing that the last minute will force you to pick a solution that’s good enough instead of wasting your time finding the optimal solution.

The law of diminishing returns says: even if you had worked way ahead of time searching for the optimal solution, at a certain point the time you spend trying to create perfection isn’t giving you a much better solution—and you were better off doing something else more valuable.

Of course, this doesn’t help if you’re doing math, where there’s usually a single correct answer, but for creative solutions with many equally good answers the last minute can be your ally.

And the final thing I want to leave you with is this:

There is no such thing as “free time.” You make time.


Any free time you have will be sucked up by some activity. No, there is no such thing as free time. You have to make time. And The Last Minute is an opportunity for you to do so.

Get to it.

cropped-ProfessorFLogoFreedomSquare.png

Calculating the Least Squares Line in 2D

by Nick V. Flor (nickflor@unm.edu) • March 17, 2015 • @ProfessorF

It can be difficult for people with no math backgrounds to follow the math (written by mathematicians on the internet) for the equation of the best line that passes through a set of N points.  So, I decided to do this math proof.

PRELIMINARIES

For starters, imagine a cloud of points, and a line that passes through those points. In your imagination, you should see some points hit the lines, while most of the points do not fall exactly on the line.  Recall that the equation of a line is:

y=mx+b

Our goal is to calculate m, the slope of the line, and to calculate b, the y-intercept.

For any point that does not fall exactly on the line—say x’,y’— The error (e) is:

e=y’-(mx’+b)

Why? Because the equation of the line would calculate y as mx’+b. However, we know that the true value that corresponds to x’ is y’. Thus, the difference is y’-y, which is e above.

Okay, so next let’s square the error to get a positive value, and let’s get rid of the ‘ to reduce clutter:

e²=(y-mx-b)*(y-mx-b)


e²=y²-2xym-2yb+m²x²+2xbm+b²

The idea of squaring the error is attributed to Gauss in the 19th century. And it’s a genius move as you’ll see later. As an aside: it’s amazing what “old” scientists were able to accomplish without the aid of calculators and computers.

Now let’s add up all the errors in the set of points, and call this total error E:

E=Σy²-2mΣxy-2bΣy+m²Σx²+2bmΣx+Nb²

What makes squaring the error and summing all errors a genius move by Gauss?

Well if you know calculus, you know that if you take derivatives of formulas and set them equal to zero, you can find minimal points on the curve (think parabola).  Thus, we can find that point in the equation where the error is minimized for m and for b, by taking partial derivatives with respect to m and b.

CALCULATE M

To calculate m, take the partial derivative of E with respect to m and set it equal to 0, then solve for m:

∂E/∂m(Σy²-2mΣxy-2bΣy+m²Σx²+2bmΣx+Nb²)=0


-2Σxy+2mΣx²+2bΣx =0


m=(2Σxy-2bΣx)/2Σx²


m=(Σxy-bΣx)/Σx² or b=(Σxy-mΣx²)/Σx

CALCULATE B

To calculate b, take the partial derivative of E with respect to b and set it equal to 0, then solve for b:

∂E/∂b(Σy²-2mΣxy-2bΣy+m²Σx²+2bmΣx+Nb²)=0


-2Σy+2mΣx+2bN=0


b=(2Σy-2mΣx)/2N


b=(Σy-mΣx)/N or

m=(Σy-Nb)/Σx

We’re not done because we have a kind of catch-22—our m equation contains b and our b equation contains m.

RECALCULATE M

To fix this and find m, set the two b equations equal to one another:

(Σxy-mΣx²)/Σx=(Σy-mΣx)/N


NΣxy-NmΣx²=ΣxΣy-m(Σx)²


m(Σx)²-NmΣx²=ΣxΣy-NΣxy


m

((Σx)²-NΣx²)=ΣxΣy-NΣxy


m=(ΣxΣy-NΣxy)/((Σx)²-NΣx²)

RECALCULATE B

Next to find b, set the two m equations equal to one another:

(Σxy-bΣx)/Σx²=(Σy-Nb)/Σx


ΣxΣxy-b(Σx)²=Σx²Σy-NbΣx²


b(NΣx²-(Σx)²)=Σx²Σy-ΣxΣxy


b=(Σx²Σy-ΣxΣxy)/(NΣx²-(Σx)²)

And we are done!  So to find the equation of a line that passes through your point cloud consisting of N points, calculate

Sx=Σx

Sy=Σy

Sxy=Σxy

Sxx=Σx²

m=(SxSy-NSxy)/((Sx)²-NSxx)

b=(SxxSy-SxSxy)/(nSxx-(Sx)²)

y=mx+b

QEDcropped-ProfessorFLogoFreedomSquare.png

Talking Politics at Work

by Nick V. Flor • March 9, 2016 • @ProfessorF

Talking politics at work can be dangerous, but these tips will keep you safe

“Nick, I’m disappointed. I thought you were a smart person.” – Co-worker after finding out our political views differed.


“He should be FIRED or at least reported to the Office of Equal Opportunity.” – A colleague after another colleague told her that she shouldn’t decide on President based on gender or race.

Yes, those are actual quotes (to the best of my memory). From my university, no less. And lest I be misunderstood, let me be clear about my number one piece of advice regarding “talking politics at work”—Don’t! Especially if you’re a teacher in a classroom. As a teacher, your goal should be to teach students how to think, not what to think. So, I find it particularly problematic when professors pontificate politics from their pedagogy! 

But if you’re aware of the risks and still want to discuss politics at work, here are some tips:

Tip #1: Don’t

I know, I said this already. But it’s important to repeat myself because you have to know the risks, which are: (a) your co-workers now think you’re either an idiot, an -ist, certainly -phobic, and perhaps even the devil himself! or (b) your company fires you!

But again if you must, here are some tips:

Tip #2: Make your goal The Truth

When arguing about politics, you’re usually arguing about political issues like Global Warming or Illegal Immigration or Free College. Your goal should be to discover The Truth about these issues, not to stubbornly defend your position to the end.

Tip #3: Understand the type of person you’re arguing with: Sports Fan, Virtue Signaller, Feeler, or Fellow Truth Seeker

You’ll notice that most people that you argue politics with either have a sports-fan mentality or they’re virtue signaling:

Sports-Fan Mentality. These people have decided that the Democrats or Republicans (or whatever political party) are “their team” and the politicians are like their favorite athletes.  For these people, their team can do no wrong, despite any fouls you may point out.

Virtue Signaling. Social media has given rise to a weird form of bragging: “virtue signaling”. This is showing off (signaling), usually on social media, how good and open-minded (virtuous!) you are to the world. To these people the truth is only relevant if it allows them to brag on Facebook about what a GOMP (Good Open-Minded Person they are).

Feeler. This is a person that puts feelings over facts. If they feel something is true, it must be true. All they need is one anecdote to validate their feeling. Once they have that anecdote, you can present them with all the facts in the world, but facts will never trump their feelings on the issue.

You can’t arrive at The Truth if you’re arguing with a Sports Fan, Virtue Signaller, or a Feeler. So politely disagree, be prepared to say why you disagree, and move on to another topic.

Tip #4: Don’t get mad, investigate: ask for data & sources, demand logic

But if you are dealing with a fellow truth seeker, here’s my first tip: Don’t get mad.

It’s easy to get mad when someone disagrees with you on a political issue, like Global Warming. But remember that political issues are complex and there’s rarely a single correct answer like there is in math.

For example, if arguing the ridiculousness of Global Warming, you may point out that the polar ice caps have grown, and they’ll counter with “but the ice layer is much thinner”, which may seem like a ridiculous claim.

But it may be true, and you owe it to The Truth to find out. So don’t get mad. Ask for proof–data, sources, anything that will help you discover the truth.

Tip #5: Disagree Agreeably

If you can’t agree on something, then make it clear you disagree but that you’ll take their position seriously and look into it. Then actually look into it. Who knows? You may be wrong in which case you’ll learn something new, and you’ll have more of the truth on your side the next time you argue politics.

Postscript: These are my popular tips on arguing politics. They’re based on a more extensive theory I have, based on an opponent’s personal philosophy: metaphysics, epistemology, ethics, politics, and aesthetics.

Markets: Post Mar08 Primaries

by Nick V. Flor • March 9, 2016 • @ProfessorF

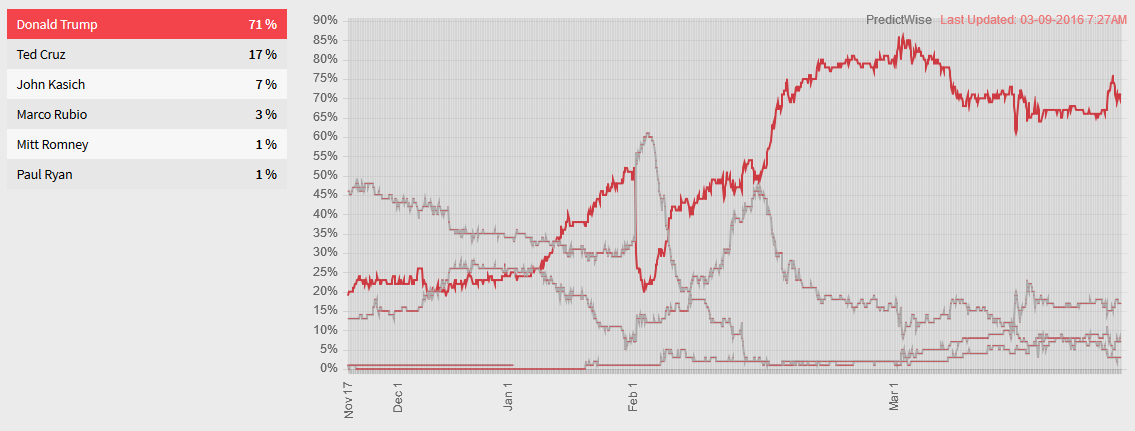
Huge shift in market preferences after the March 08 primaries, which were “won” by Donald Trump.  Before I get to the shift, let’s look at the results:

NYTimes09Mar16Second, the prediction market:

PredictWise09Mar16Note that Trump’s percentages have gone up 4pts since my last report. However, Cruz looks to have solidified his position as the #2 candidate and, more significantly, Kasich has surged 4 points ahead of Rubio to take the #3 spot.  Kasich has not won a single primary, so his surge past Rubio suggests that the market believes he is the new “Establishment” candidate.

cropped-ProfessorFLogoFreedomSquare.png

Principal Components Analysis in Excel VBA

by Nick V. Flor • March 9, 2016 • @ProfessorF

I love Excel as an Exploratory Data Analysis tool. I’ve written macros to scrape data off of Twitter (like the millions of tweets for every #GOPDebate), and then to analyze that data in various ways—both quantitatively and qualitatively, both with & without hypotheses!

I have to say, it’s both astonishing and mind-boggling what you find when you let the data speak for itself.  In later posts, I’ll discuss some of my findings.

But for now I’m on a mission to get citizens to level-up their “data analysis” skills—it’s the only way to prevent being fooled by politicians and charlatans.

Anyway, one particularly useful statistical procedure for analyzing large amounts of data is Principal Components Analysis (“PCA”).  It is both a way of reducing the complexity (dimensionality) of your data, and finding structure in your data.

Of course Excel doesn’t implement PCA, and the math on the internet is cryptic. So it’s not clear how to implement the necessary functions. Here’s one way I do PCA, using  Gram-Schmidt QR decomposition.

Note: fmMult is my own matrix multiplication function, you can probably get away with Excel’s mmult. I also reindex the matrices from 0..N-1. This makes it easier for me to convert the code to C# or JavaScript.


'
' QR Decomposition Function using Gram-Schmidt
' Adapted from pseudo-code in http://www.math.umn.edu/~olver/ln_/qr.pdf
'
Function GramSchmidt(ByRef A, ByRef R)
Dim mRows, nCols
Dim i, j, k

getNumRowsCols A, mRows, nCols
R = createMatrix(mRows, nCols)
For j = 0 To (nCols - 1)
    R(j, j) = 0
    For i = 0 To (mRows - 1)
        R(j, j) = R(j, j) + A(i, j) ^ 2
    Next
    R(j, j) = Sqr(R(j, j))
    For i = 0 To (mRows - 1)
        A(i, j) = A(i, j) / R(j, j)
    Next
    For k = (j + 1) To (nCols - 1)
        R(j, k) = 0
        For i = 0 To (mRows - 1)
            R(j, k) = R(j, k) + A(i, j) * A(i, k)
        Next
        For i = 0 To (mRows - 1)
            A(i, k) = A(i, k) - A(i, j) * R(j, k)
        Next
    Next
Next
End Function

Function pfGramSchmidt(AR As Range, Optional loops As Integer = -1)
Dim A, Q, R, i, j, E

If loops < 0 Then loops = 0 ' this is really one iteration

A = reindexRange(AR)
getNumRowsCols A, mRows, nCols
R = createIdentity(mRows, nCols)
E = createIdentity(mRows, nCols)

For i = 0 To loops    
    A = fmMult(R, A) ' A=R*Q
    GramSchmidt A, R ' A is now Q, Diagonals are Eigenvalues
    E = fmMult(E, A) ' E: Eigenvectors
Next
'
' Return a Range with Q, R, and Eigenvalues 
'
ReDim res(mRows - 1, (3 * nCols) - 1)
For i = 0 To mRows - 1
    For j = 0 To nCols - 1
        res(i, j) = A(i, j)
        res(i, nCols + j) = R(i, j)
        res(i, 2 * nCols + j) = E(i, j)
    Next
Next
pfGramSchmidt = res
End Function


If you have any questions about how to use this, or to implement it yourself, I’m always happy to help.

Good luck.

cropped-ProfessorFLogoFreedomSquare.png

Cronbach’s Alpha in Excel VBA

by Nick V. Flor • March 8, 2016 • @ProfessorF

Here’s the bulk of my implementation of Cronbach’s Alpha in Excel VBA. If you’re having problems with the formula on the internet, hopefully this piece of code explains how to translate the math into code. This is the formula:

CronbachsAlpha

Note: I use 0-based matrices (0..N-1), vs Excel matrices which go from 1..N. This makes it easier for me to convert the code to JavaScript or CE.  Also, there’s a pre-processing function I use (not shown) that converts an Excel Selection range into a 0-based matrix, which is the Y parameter and corresponds to your columns of data that are part of your index X. Finally I use many utility functions like createMatrix, which should be self-explanatory.

Function fCron(Y)
Dim mRows, nCols, i, j
Dim X, V, sumVY, VX

    getNumRowsCols Y, mRows, nCols
    
    ' Calculate X vector=SUM Y-Rows
    X = createMatrix(mRows, 1)
    For i = 0 To (mRows - 1)
        For j = 0 To (nCols - 1)
            X(i, 0) = X(i, 0) + Y(i, j)
        Next
    Next
    VX = fVar(X, 0) ' Variance of X
    
    ' Calculate Variances of Ys
    VY = createMatrix(1, nCols)
    sumVY = 0
    For j = 0 To (nCols - 1)
        VY(0, j) = fVar(Y, j) ' for debugging
        sumVY = sumVY + VY(0, j) ' Sum of Y Variances
    Next
    
    k = nCols
    fCron = (k / (k - 1)) * (1 - (sumVY / VX))
End Function

If you need help implementing any of these functions or understanding the code, I’m happy to answer your questions.

In my opinion, Excel cannot be beat for Exploratory Data Analysis of social media postings. It’s just missing a couple of key functions like factor extractions, factor rotation, reliability indicators, clustering, sentiment analysis, and social networking graphs.

Good luck!

cropped-ProfessorFLogoFreedomSquare.png

Varimax Rotation in Excel VBA

by Nick V. Flor • March 7, 2016 • @ProfessorF

Here’s my implementation of the Varimax Rotation algorithm — written in Excel VBA — based on IBM’s SPSS algorithm, which in turn is based on Harman (1976). The main difference is that I use a counter to control iteration. Note: I use custom functions, but the algorithm follows IBM’s math, so the functions should be self-explanatory.

Function fVarimax(F, loops)
    Dim H, Hinv, i, j, k, Lambda, LL, mRows, nCols, Omega
    Dim u, v, A, B, C, D, X, Y, P, rot
    Hinv = calcHinv(F)
    H = calcH(F)
    Lambda = fmMult(Hinv, F)

    getNumRowsCols Lambda, mRows, nCols
    For Z = 1 To loops 
        For i = 0 To (nCols - 2)
            For j = (i + 1) To (nCols - 1)
                u = calcU(Lambda, i, j)
                v = calcV(Lambda, i, j)
                A = 0
                B = 0
                C = 0
                D = 0
                For k = 0 To (mRows - 1)
                    A = A + u(k, 0)
                    B = B + v(k, 0)
                    C = C + (u(k, 0) ^ 2 - v(k, 0) ^ 2)
                    D = D + (2 * u(k, 0) * v(k, 0))
               Next
               X = D - (2 * A * B) / mRows
               Y = C - (A ^ 2 - B ^ 2) / mRows
               P = 0.25 * Atn(X / Y)
               rot = createRot(P)
               LL = rotateFactors(Lambda, i, j, rot)
               Lambda = replaceFactors(Lambda, LL, i, j)
            Next
        Next
    Next
    Omega = fmMult(H, Lambda)
    fVarimax = Omega
End Function
Harman, H. H. (1976). Modern factor analysis. University of Chicago Press.
IBM Corp (2013). IBM SPSS Statistics 23 Documentation. Armonk, NY: IBM Corp.  Retrieved March 6, 2016.
cropped-ProfessorFLogoFreedomSquare.png
1 2